
Each task is an image–text bundle; outputs are long-form reports with citations.
Reproducible pipeline for report quality, citation grounding, and visual integrity.
Overall and per-metric results, with modality and retrieval settings labeled.
Recent advancements in foundation models have driven a paradigm shift from static, language-centric systems to Large Multimodal Models (LMMs) capable of jointly processing text and visual inputs. While modern LMMs can reason over structured artifacts like charts and documents, they remain limited by fixed parametric memory. This limitation has motivated the rise of Deep Research Agents (DRAs)—systems that autonomously browse the web, retrieve external evidence, and synthesize long-form reports to answer open-ended questions.
However, a critical gap remains in existing evaluation frameworks for real-world research. Prior work largely falls into two categories: text-only deep research, which neglects the role of visual evidence in research reasoning, and short-horizon multimodal perception tasks (e.g., image captioning or localized visual understanding) that fail to capture the long-horizon planning and integrative reasoning required by authentic research problems. In practice, real-world research depends on aligning and cross-validating textual claims with visual evidence such as scientific figures, medical images, or financial charts. This fragmentation in current benchmarks therefore creates a structural deficiency, limiting their ability to faithfully assess true multimodal research capabilities.
MMDeepResearch-Bench (MMDR-Bench) bridges this gap as the first benchmark explicitly designed to evaluate end-to-end multimodal deep research—from parsing images and planning searches to producing grounded, citation-rich reports. Every task is packaged as an image-text bundle, pushing agents beyond simple "seeing" toward "researching with vision."
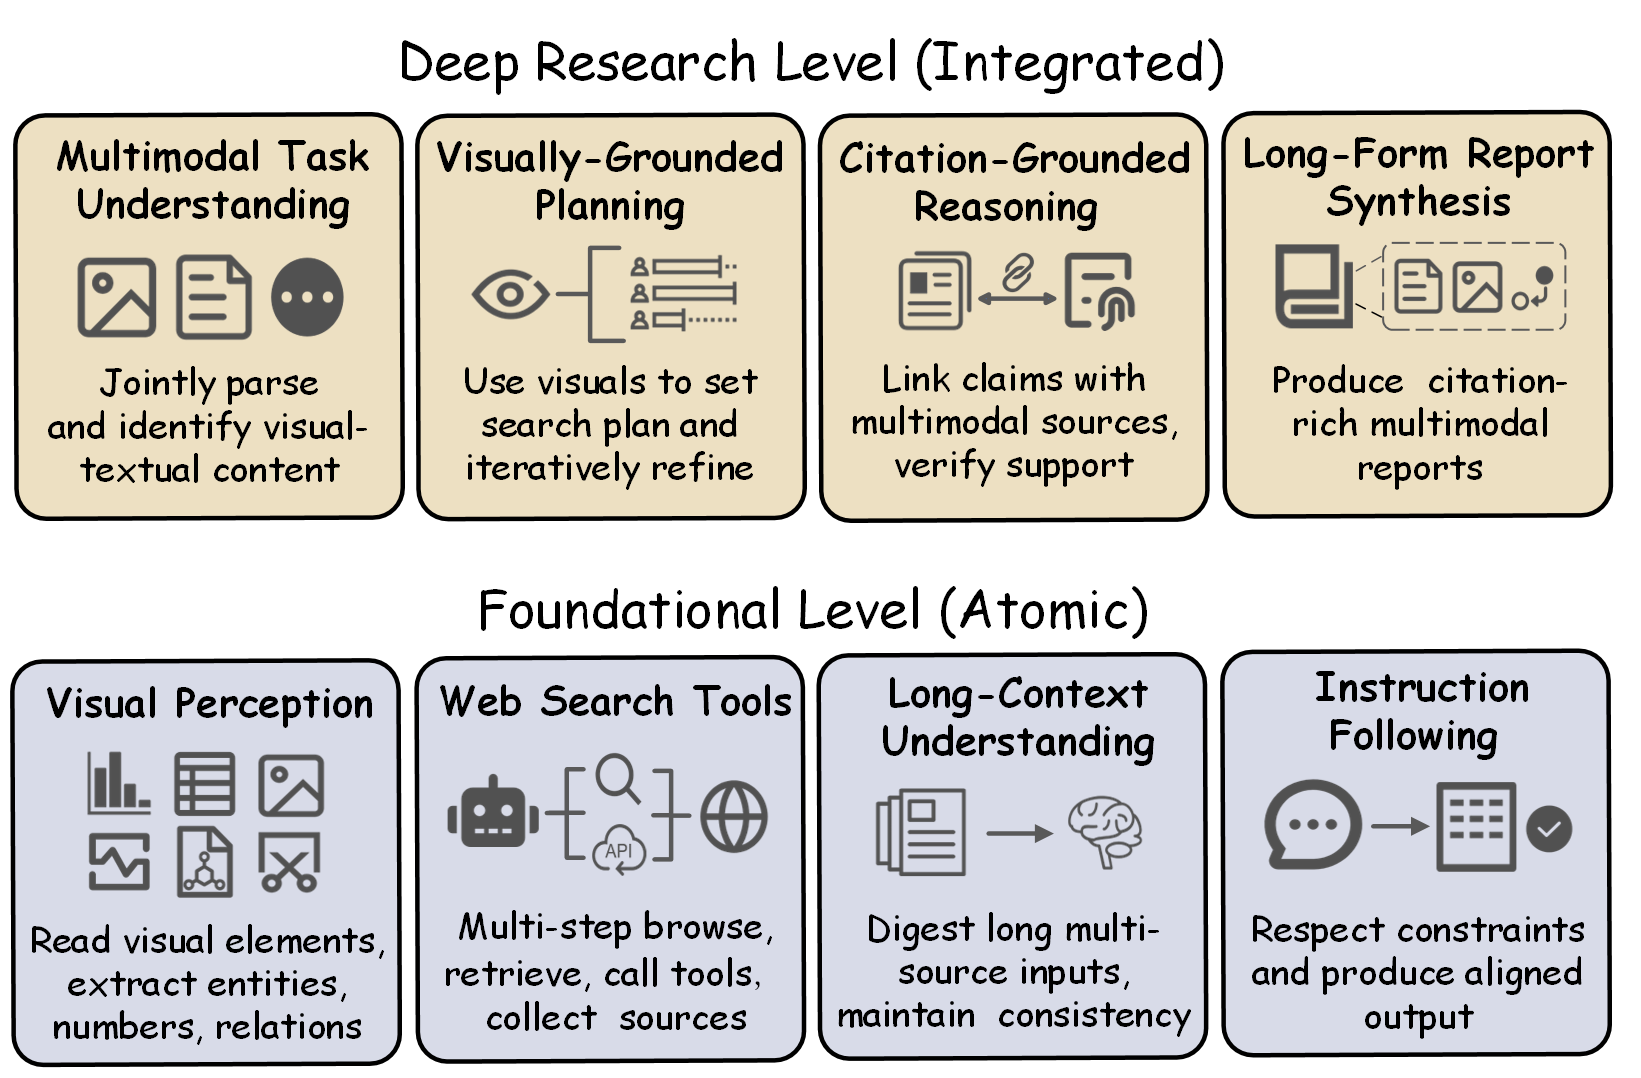
As illustrated in Figure 1, MMDR-Bench evaluates agents across two capability levels. At the Foundational Level (Atomic), we assess robust Visual Perception, effective Web Search Tools usage (when enabled), Long-Context Understanding, and strict Instruction Following. At the Deep Research Level (Integrated), agents must demonstrate Multimodal Task Understanding, Visually-Grounded Planning, Citation-Grounded Reasoning, and Long-Form Report Synthesis.
To operationalize this, we propose a set of innovatively designed evaluation metrics including FLAE (report quality), TRACE (citation verification), and MOSAIC (visual integrity) that provide relaible, evidence-aligned measurements of the capacities of multimodal deep research agents.
MMDR-Bench comprises 140 expert-crafted tasks spanning 19 diverse domains. Each instance is packaged as an image-text bundle—a textual query paired with necessary visual artifacts. Images are treated as evidence: the agent must interpret them, verify claims, and cite sources in the final report.
Tasks are organized into two complementary regimes: Daily (breadth) and Research (depth).
{
    "caption": ".......",
    "body": "........",
    "image_url": ["image/Q0I0.jpg", "image/Q0I1.jpg", "image/Q0I2.jpg"],
    "tags": ["HCS"],
    "language": "zh",
    "difficulty": "easy"
  }
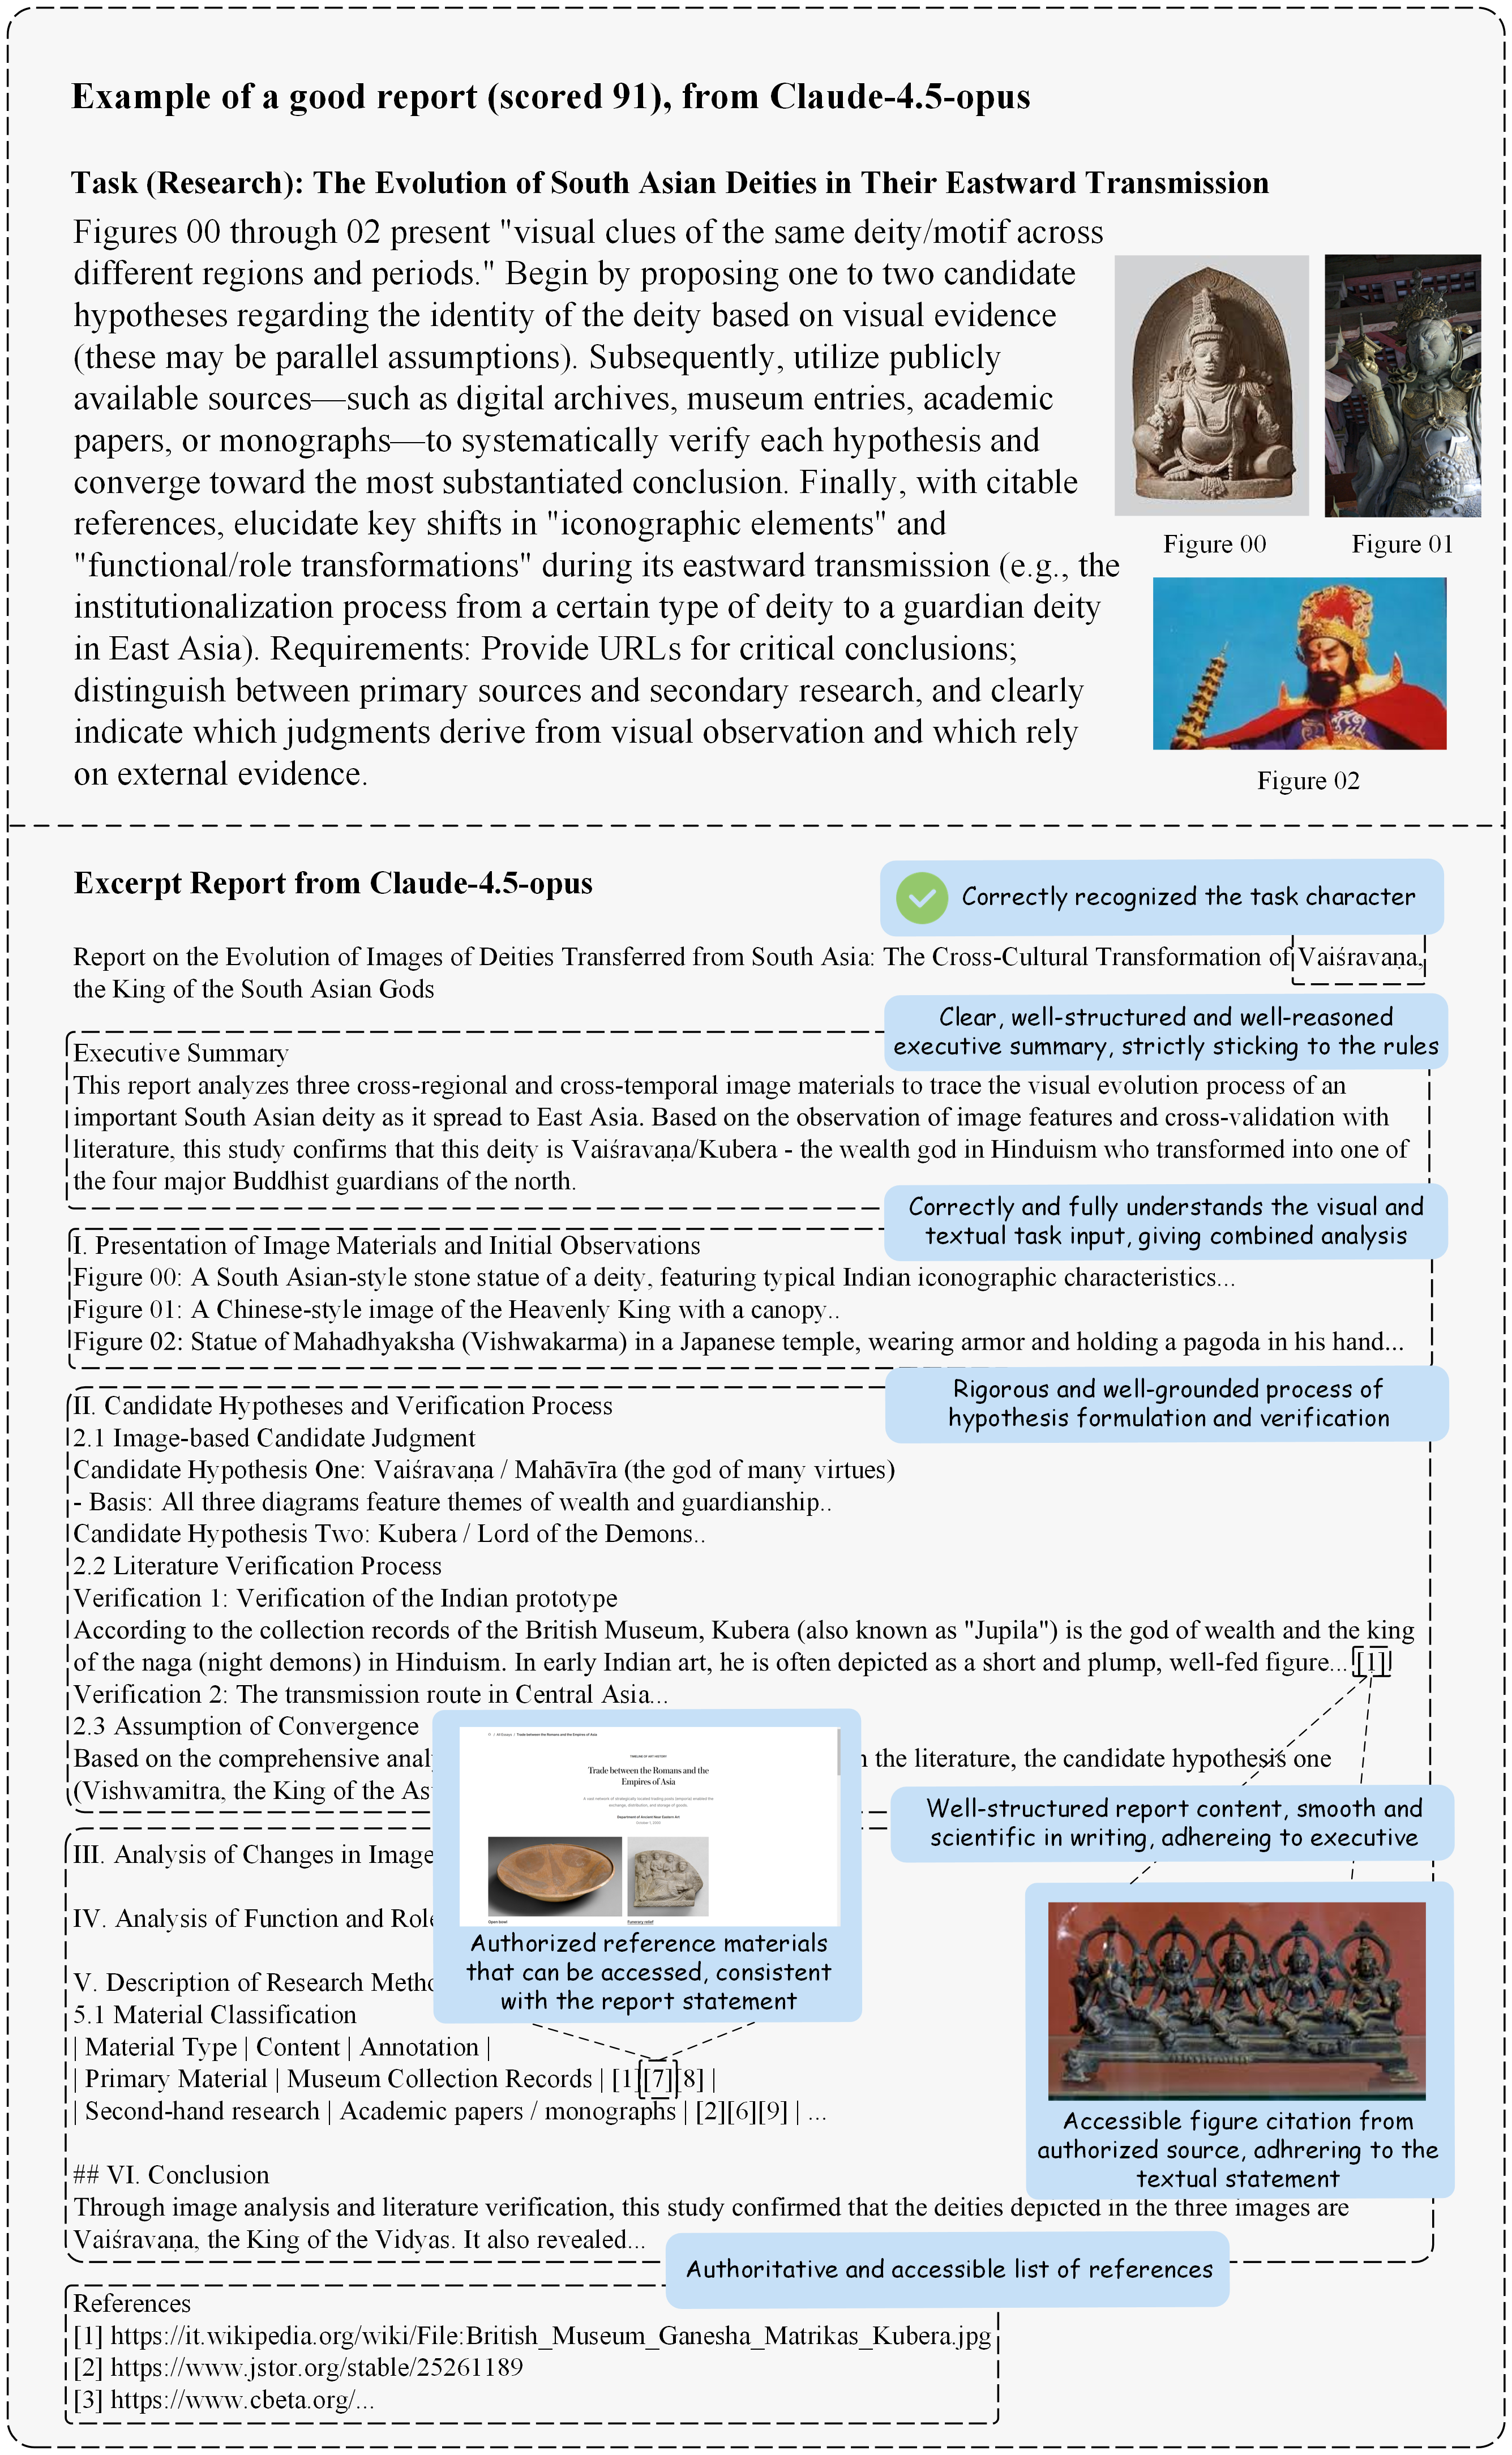
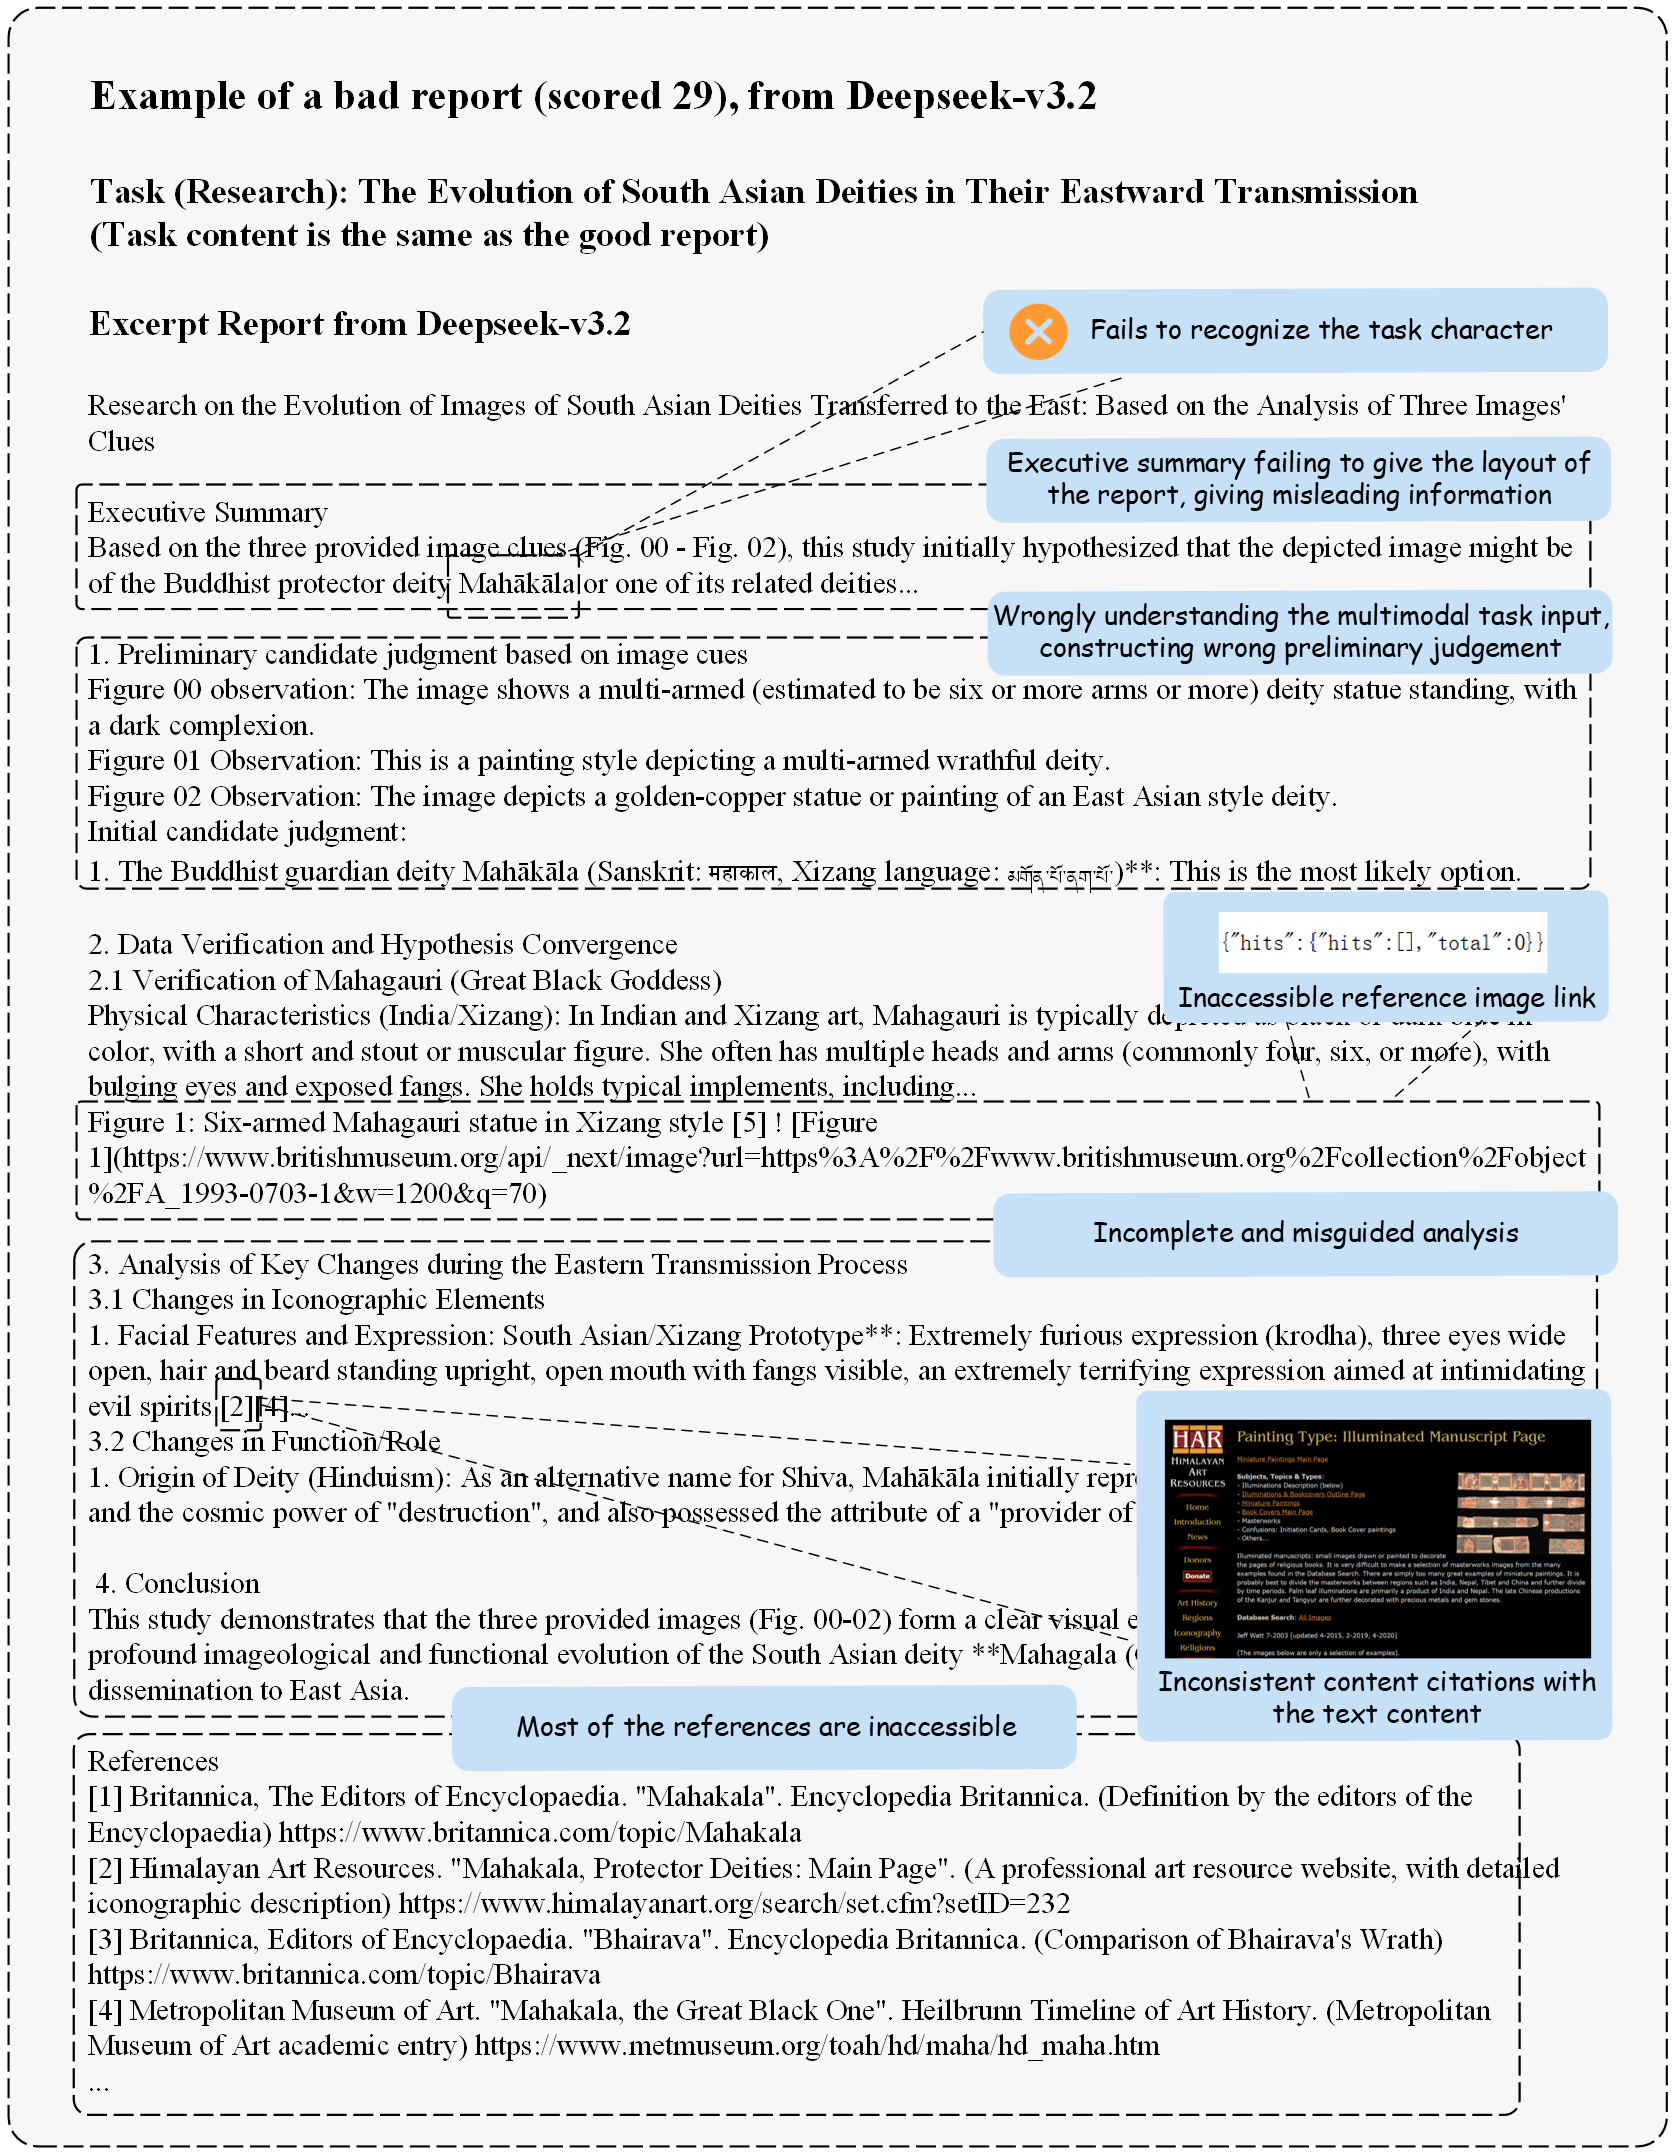
## Executive Summary
...

## Evidence-backed Analysis
Claim ... [1]
Claim ... [2]

## References
[1] https://...
[2] https://...

Daily tasks simulate everyday needs with loosely structured visuals like screenshots, photographs, and UI captures. The challenge is grounding: agents must handle noisy images and gather lightweight, verifiable evidence (e.g., local availability checks).
Research tasks emphasize analysis-heavy settings with information-dense visuals such as scientific charts, diagrams, and tables. Success requires precise extraction from pixels and synthesis with literature into professional, citation-grounded reports.

All tasks were iteratively refined by PhD-level domain experts to ensure visual evidence is necessary—tasks cannot be solved by text search alone.
Overall and per-metric results across evaluated systems
| Model | Overall | Read. | Insh. | Stru. | Vef. | Con. | Cov. | Fid. | Sem. | Acc. | VQA |
|---|
Our evaluation across state-of-the-art systems reveals substantial capability gaps and non-trivial trade-offs. Even when the final task is “just write a report”, success depends on whether a system can (i) correctly read information from images, (ii) retrieve and consolidate supporting evidence, and (iii) keep citations aligned with the right claims.
The strongest systems do not merely generate fluent reports; they succeed because they maintain end-to-end coherence across planning, retrieval, reading, and verification. Empirically, deep research agents only yield gains when built on a capable backbone and integrated into a stable pipeline—agent scaffolding alone cannot compensate for weak underlying models. This demonstrates that deep research performance is fundamentally a system property: failures emerge from pipeline breaks, not isolated module weaknesses.
While retrieval increases evidence coverage, it also introduces a compounding risk: as sources accumulate, consolidation errors become more likely than retrieval failures. In practice, Entity Mis-identification (EMI) emerges as the primary breakdown, where correct facts are systematically assigned to the wrong entities after multiple reasoning hops. For image-anchored tasks, this creates a particularly deceptive failure pattern—reports remain fluent and well-supported at the source level, yet are fundamentally incorrect at the entity level.
Many models are able to produce coherent, well-structured reports, achieving high scores on writing-oriented dimensions (FLAE), while still failing to maintain precise alignment between claims and their supporting evidence. A common failure mode is a report that appears plausible and well-written but lacks verifiable support—for example, key statements without valid citations, irrelevant sources, or references that do not substantiate the claimed facts. This dissociation highlights that fluent synthesis and grounded synthesis remain systematically separable capabilities.
Multimodality is not a guaranteed win. When the prompt already contains most necessary information, a vision-language model may over-trust noisy pixels and misread small details (ticks, tiny legend keys, axis labels). These Detail Extraction failures (DTE) can cascade: a single wrong number or label can poison downstream search queries and lead to a completely off-track report—even if the model is otherwise strong at writing.
Correctly “recognizing what’s in the image” is only the start. Many tasks require converting visual evidence into checkable claims: reading values, comparing trends, extracting architectural hyperparameters, or reconciling a table with text. This is reflected by MOSAIC’s separation into Sem. (semantic match), Acc. (data accuracy), and VQA (complex reasoning). Systems can be semantically aligned yet still fail on numeric accuracy or multi-step visual reasoning.
For improving a deep-research system, “overall score” is useful but not diagnostic. The leaderboard is designed to isolate bottlenecks: Read./Insh./Stru. diagnose report quality; Vef./Con./Cov./Fid. diagnose citation-grounded reasoning; Sem./Acc./VQA diagnose visual integrity. The same system can be excellent at long-form writing yet fail on one narrow visual detail, or it can retrieve a lot yet lose entity consistency.
| DTE | Detail Extraction: misreading small visual details (ticks, tiny text, legend keys). |
|---|---|
| EMI | Entity Mis-identification: mixing entities across sources (wrong person/product/paper). |
| RMD | Reasoning Mistake: incorrect inference or logic even with correct evidence. |
| LKC | Link/Citation Issue: dead, inaccessible, or irrelevant links; citation not supporting the claim. |
| STO | Style/Structure Off: poor organization; missing required sections; not report-like. |

We provide qualitative comparisons between a high-scoring and a low-scoring report on the same task to make failure patterns concrete.